Song Shi, University of Technology Sydney; Mustapha Bangura, University of Technology Sydney, and Sumita Ghosh, University of Technology Sydney
If you’re buying a house near a river or on a floodplain, you will likely come up against the question of flood risk. We usually talk about this in terms of chance.
Houses close to the river might be at risk of a 1-in-100 year flood, meaning there’s a 1% chance a flood could hit in any given year. Houses further back might be at risk of a 1-in-500 year flood (0.2% chance). Truly extreme floods might be 1-in-1,000 or even 10,000 years. This way of thinking about flood risk is technically known as an Annual Exceedance Probability (AEP).
What does flood risk translate to? Our recent research found houses in the New South Wales town of Richmond with an AEP of 100 – meaning a 1-in-100 year flood – come at a discount of almost 11% compared to similar homes without the risk. We are prepared to pay less for houses we think might flood.
But what’s really interesting is how quickly this discount drops off. A house in an AEP 500 zone (1-in-500 years) has a 4.4% discount. There’s no discount for houses in an AEP 1,000 zone, at risk from a 1-in-1,000 year flood. People simply ignore this risk as if it doesn’t exist. But it does. The floods which devastated Lismore in 2022 were roughly 1-in-1,000 year floods – so extreme we think it won’t happen. But it can and does.
When we assess the risk of natural disasters, we often ignore or underestimate events with a low probability but high severity. But as climate change makes floods worse and worse, this is a problem. The lethal floods in Spain came after a year’s worth of rain fell in a few hours in some areas. We underestimate floods at our peril.
What a flood-prone town tells us about risk
When we think of the risk of natural disasters such as bushfires, floods and earthquakes, our perceptions tend to be bounded by thresholds. We focus on the most likely threats and tend to ignore or play down the risk of severe events with low probability.
This may have made sense historically. But this approach won’t cut it in the future. Climate change is already making severe floods more likely, including flash floods and rivers breaking their banks.
For authorities tasked with managing flood risk, this poses a major challenge. The gap between how we see these risks and the actual threat they pose could lead to major losses of lives and property. Our research suggests people stop assessing risk beyond 1-in-500 year floods (AEP 500).
In our research, we looked at Richmond, a flood-prone town of about 14,500 people in the Hawkesbury-Nepean Valley in New South Wales, and surrounding areas. This area has a long history of significant and dangerous flooding.
In the last few years, it has had five major floods, in February 2020, March 2021 and March, April and July 2022. Major floods here indicate the river has risen over 12 metres.
We used home sales data and the region’s digital flood maps to gauge how people were assessing risk in flood-prone areas.
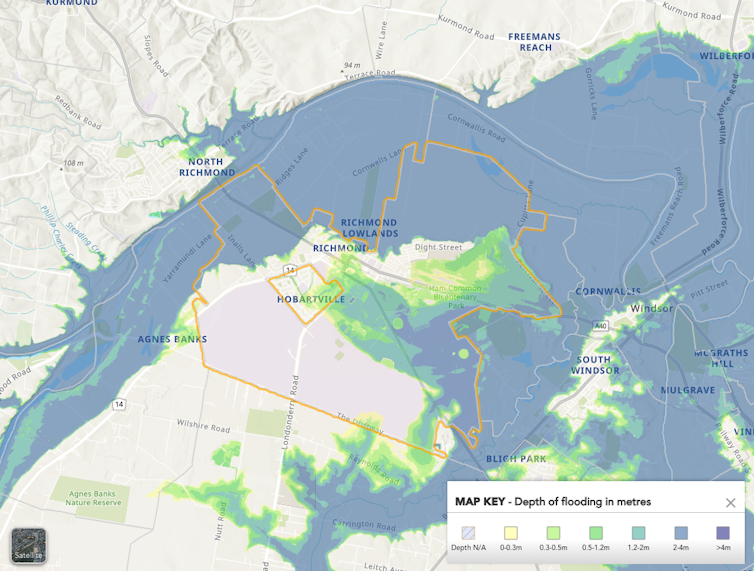
Digital flood maps are widely used to assess the risk of flood at a specific location. In 2019, the NSW government conducted a regional flood study for the 500 square kilometre Hawkesbury-Nepean Valley, capitalising on advances in flood modelling and changes to the floodplain. These maps were updated in 2023. We used both of these maps so we could verify our findings and see how changes in the updated version changed people’s perception of risks.
These maps are very influential, as they directly shape how people see the risk of floods near them. We found these maps have strengthened residents’ perceptions of flood risk.

Digital flood maps of the Hawkesbury-Nepean Valley have been influential in showing residents the areas at risk – but low probability high severity floods are a blind spot.
NSW State Emergency Service, CC BY-NC-ND
For instance, houses with the same flood risk levels across both 2019 and 2023 flood maps saw greater drops in price compared to houses where the risk level had changed or was unclear.
In recent years, insurers have jacked up flood insurance premiums, which could mean affected residents underinsure themselves in the future. In 2023, Richmond’s median house price was A$825,000. But if it was in the 1-in-100 AEP 100 flooding zone, our research suggests it would be discounted by about 11% ($89,100).
But while the upfront cost may be less, owners of these homes will have to pay substantially higher insurance premiums as long as they own it. Getting insurance in a AEP 100 flood zone can be much more expensive than people think.
For authorities, these maps help identify areas most vulnerable to extreme flood events, such as over a 1-in-500 year flood.
As we prepare for more severe floods hitting more often, authorities need to give people as much notice as possible.
Ahead of a major rain event, we suggest authorities should release digital flood maps of areas likely to be affected – including different AEP levels. If a extreme flood (1-in-500 years or more) is likely, people living in areas with little or no flooding in their lifetimes will be affected. They need to know. ![]()
Song Shi, Associate Professor, Property Economics, University of Technology Sydney; Mustapha Bangura, Lecturer in Property Economics, University of Technology Sydney, and Sumita Ghosh, Associate Professor in Planning, University of Technology Sydney
This article is republished from The Conversation under a Creative Commons license. Read the original article.

